Reconcile before reporting
Stage each source separately, filter identifiers and use SQL window functions to deduplicate records. An explicit mapping connects ERP products to web sales before any revenue calculation.
Data engineering & automation
Case study / 01
From fragmented catalogs to a traceable revenue view.
Three spreadsheet sources. One explicit data flow. SQL reconciliation, quality checks and statistical price flags, connected through a Kestra workflow.
Technologies & concepts
Technical demonstration / selected source
Private repository

01 / The context
Product prices, inventory identifiers and web sales often live in separate files. Inconsistent keys and duplicated website records make it difficult to assemble a coherent revenue view. This demonstration explores how explicit cleaning rules, traceable joins and checks between stages make that work inspectable.
02 / Engineering decisions
Stage each source separately, filter identifiers and use SQL window functions to deduplicate records. An explicit mapping connects ERP products to web sales before any revenue calculation.
Check key uniqueness, compare derived revenue with joined records and review segment coverage. The Kestra source illustrates dependencies, retries and independent export branches.
Price scoring uses population standard deviation and a z-score threshold above two. This is a flag for review; it does not establish product quality or business value.
03 / System view
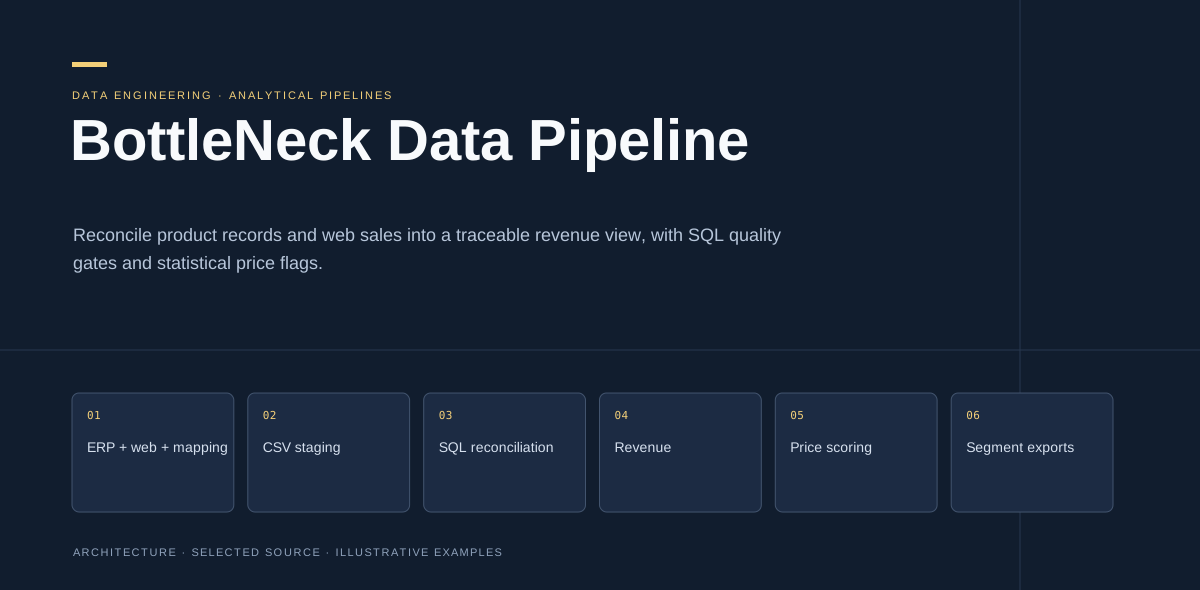
Illustrative architecture from the project presentation. It describes the selected design; it does not imply a deployed service or a measured operational result.
View the full-size diagramERP + web + mapping
CSV staging
SQL reconciliation
Revenue
Price scoring
Segment exports
04 / Selected artifacts
Five SQL cleaning, reconciliation and revenue transformationsPython ingestion, price scoring, exports and quality checksKestra workflow describing dependencies and retriesArchitecture visual and static technical presentation05 / Scope & limitations
Demonstration and selected-source showcase, without original inputs or generated business reports. Revenue uses matched quantity × unit price; historical pricing, discounts, tax and returns are outside this example. Inner joins omit unmatched records. ERP and mapping deduplication have no business tie-breaker. Complete deployment validation, unmatched-record reporting and operational monitoring would need further work.
The GitHub repository is private. Its link works for authorized collaborators; other visitors can contact me to discuss the project.
Next case study / 02
The next conversation